

Fourth quarter summary:
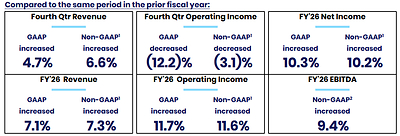
- GAAP revenue increased 4.7% and GAAP operating income decreased 12.2% for the fiscal three months ended
June 30, 2026 , compared to the prior fiscal year quarter. - Non-GAAP adjusted revenue increased 6.6% and non-GAAP adjusted operating income decreased 3.1% for the fiscal three months ended
June 30, 2026 , compared to the prior fiscal year quarter.1 - GAAP EPS was
$1.57 per diluted share for the fiscal three months endedJune 30, 2026 , compared to$1.75 per diluted share in the prior fiscal year quarter representing contraction of 10.2%. - Stock repurchases for the fiscal three months ended
June 30, 2026 , were$164 million at an average price of$140 per share.
Fiscal year summary:
- GAAP revenue increased 7.1% and GAAP operating income increased 11.7% for the fiscal year ended
June 30, 2026 , compared to the prior fiscal year. - Non-GAAP adjusted revenue increased 7.3% and non-GAAP adjusted operating income increased 11.6% for the fiscal year ended
June 30, 2026 , compared to the prior fiscal year.1 - GAAP EPS was
$6.98 per diluted share for the fiscal year endedJune 30, 2026 , compared to$6.24 per diluted share in the prior fiscal year representing growth of 11.9%. - Cash and cash equivalents were
$12.1 million atJune 30, 2026 , and$102.0 million atJune 30, 2025 . - Debt outstanding for credit facilities was
$40 million atJune 30, 2026 , and$0 atJune 30, 2025 . - Stock repurchases for fiscal year ended
June 30, 2026 , were$448 million at an average price of$152 per share.
Full year fiscal 2027 guidance (Dollars in millions, other than per share amounts):3
|
Current |
||
|
GAAP |
Low |
High |
|
Revenue |
|
|
|
Operating margin4 |
24.5 % |
24.7 % |
|
EPS |
|
|
|
Non-GAAP5 |
||
|
Adjusted revenue |
|
|
|
Adjusted operating margin |
24.1 % |
24.3 % |
|
1 See tables below on page 4 reconciling non-GAAP financial measures to GAAP. |
|
2See table below on page 14 reconciling net income to non-GAAP EBITDA. |
|
3 The full fiscal year guidance assumes no acquisitions or dispositions will be made during fiscal year 2027. |
|
4Operating margin is calculated by dividing operating income by revenue. |
|
5See tables below on page 9 reconciling fiscal year 2027 GAAP to non-GAAP guidance. |
|
According to |
Operating Results
Revenue, operating expenses, operating income, and net income for the fiscal three months and fiscal year ended
|
Revenue |
|||||||||||
|
(Unaudited, dollars in thousands) |
Three Months Ended |
% |
Year Ended |
% |
|||||||
|
2026 |
2025 |
2026 |
2025 |
||||||||
|
Revenue |
|||||||||||
|
Services and Support |
$ 360,195 |
$ 351,239 |
2.5 % |
$ 1,448,003 |
$ 1,361,737 |
6.3 % |
|||||
|
Percentage of Total Revenue |
55.9 % |
57.1 % |
56.9 % |
57.3 % |
|||||||
|
Processing |
283,828 |
264,133 |
7.5 % |
1,096,336 |
1,013,551 |
8.2 % |
|||||
|
Percentage of Total Revenue |
44.1 % |
42.9 % |
43.1 % |
42.7 % |
|||||||
|
REVENUE |
$ 644,023 |
$ 615,372 |
4.7 % |
$ 2,544,339 |
$ 2,375,288 |
7.1 % |
|||||
- Services and support revenue increased for the fiscal three months ended
June 30, 2026 , compared to the fiscal three months endedJune 30, 2025 , primarily driven by growth in data processing and hosting revenue within private and public cloud revenue of 7.4% and higher license and hardware revenue by 27.3% and increased education, royalty, and other revenues by 38.6% partially offset by a decrease in deconversion revenue of$11,168 . Processing revenue increased for the fiscal three months endedJune 30, 2026 , compared to the fiscal three months endedJune 30, 2025 , mainly driven by growth in card revenue of 5.4% from monthly service and risk management fees, improvement in Jack Henry digital and transaction revenue of 8.6% from a higher number of active users on our digital platform, and a rise in faster payments revenue of 47.0%.
- Services and support revenue increased for the fiscal year ended
June 30, 2026 , compared to the fiscal year endedJune 30, 2025 , primarily driven by growth in data processing and hosting revenue within private and public cloud revenue of 8.5%, higher consulting, work orders and release fees revenue by 13.0%, a rise in implementation revenue by 14.1%, and increased license and hardware revenue by 19.5% partially offset by the decrease in software usage revenue (mainly due to a contract change in the prior fiscal year) by 26.2%. Processing revenue increased for the fiscal year endedJune 30, 2026 , compared to the fiscal year endedJune 30, 2025 , mainly driven by growth in card revenue of 6.0% from monthly service and risk management fees, improvement in Jack Henry digital and transaction revenue of 11.6% from a higher number of active users on our digital platform, and a rise in faster payments revenue of 49.5%.
- For the fiscal three months ended
June 30, 2026 , compared to the fiscal three months endedJune 30, 2025 , core segment revenue increased 1.9%, payments segment revenue increased 4.9%, complementary segment revenue increased 4.7%, and corporate services segment revenue increased 30.4%. For the fiscal three months endedJune 30, 2026 , compared to the fiscal three months endedJune 30, 2025 , core segment non-GAAP adjusted revenue increased 6.0%, payments segment non-GAAP adjusted revenue increased 6.1%, complementary segment non-GAAP adjusted revenue increased 5.6%, and corporate services non-GAAP adjusted segment revenue increased 31.3%. Total non-GAAP adjusted revenue increased 6.6% for the same comparative periods (see revenue lines of segment break-out tables on pages 5 and 6 below for a reconciliation of GAAP segment revenue to non-GAAP adjusted segment revenue).
- For the fiscal year ended
June 30, 2026 , compared to the fiscal year endedJune 30, 2025 , core segment revenue increased 4.8%, payments segment revenue increased 7.2%, complementary segment revenue increased 8.3%, and corporate services segment revenue increased 18.3%. For the fiscal year endedJune 30, 2026 , compared to the fiscal year endedJune 30, 2025 , core segment non-GAAP adjusted revenue increased 7.1%, payments segment non-GAAP adjusted revenue increased 6.4%, complementary segment non-GAAP adjusted revenue increased 7.7%, and corporate services non-GAAP adjusted segment revenue increased 18.3%. Total non-GAAP adjusted revenue increased 7.3% for the same comparative periods (see revenue lines of segment break-out tables on pages 7 and 8 below for a reconciliation of GAAP segment revenue to non-GAAP adjusted segment revenue).
|
Operating Expenses and Operating Income |
||||||||||||
|
(Unaudited, dollars in thousands) |
Three Months Ended |
% |
Year Ended |
% |
||||||||
|
2026 |
2025 |
2026 |
2025 |
|||||||||
|
Cost of Revenue |
$ 370,175 |
$ 343,879 |
7.6 % |
$ 1,433,651 |
$ 1,360,747 |
5.4 % |
||||||
|
Percentage of Total Revenue6 |
57.5 % |
55.9 % |
56.3 % |
57.3 % |
||||||||
|
Research and Development |
49,830 |
42,580 |
17.0 % |
176,445 |
162,771 |
8.4 % |
||||||
|
Percentage of Total Revenue6 |
7.7 % |
6.9 % |
6.9 % |
6.9 % |
||||||||
|
Selling, General, and Administrative |
87,245 |
73,216 |
19.2 % |
299,210 |
283,055 |
5.7 % |
||||||
|
Percentage of Total Revenue6 |
13.5 % |
11.9 % |
11.8 % |
11.9 % |
||||||||
|
OPERATING EXPENSES |
507,250 |
459,675 |
10.3 % |
1,909,306 |
1,806,573 |
5.7 % |
||||||
|
OPERATING INCOME |
$ 136,773 |
$ 155,697 |
(12.2) % |
$ 635,033 |
$ 568,715 |
11.7 % |
||||||
|
Operating Margin6 |
21.2 % |
25.3 % |
25.0 % |
23.9 % |
||||||||
- Cost of revenue increased for the fiscal three months and fiscal year ended
June 30, 2026 , compared to the fiscal three months and fiscal year endedJune 30, 2025 , primarily due to higher personnel costs, including compensation and benefit costs, partially related to trailing twelve month headcount growth, higher direct costs generally consistent with increases in related lines of revenue, as well as higher amortization of capitalized software and increased internal licenses and fees.
- Research and development expense increased for the fiscal three months and fiscal year ended
June 30, 2026 , compared to the fiscal three months and fiscal year endedJune 30, 2025 , primarily due to higher personnel costs (net of capitalization), including compensation and benefit costs, partially related to trailing twelve month headcount growth.
- Selling, general, and administrative expense increased for the fiscal three months and fiscal year ended
June 30, 2026 , compared to the fiscal three months and fiscal year endedJune 30, 2025 , mainly due to higher personnel costs, including increased medical costs from second-half normalization trends and higher compensation tied to trailing twelve month headcount growth.
Net Income
|
(Unaudited, in thousands, except per share data) |
Three Months Ended |
% |
Year Ended |
% |
|||||||
|
2026 |
2025 |
2026 |
2025 |
||||||||
|
Income Before Income Taxes |
$ 139,738 |
$ 159,949 |
(12.6) % |
$ 652,790 |
$ 586,036 |
11.4 % |
|||||
|
Provision for Income Taxes |
28,510 |
32,345 |
(11.9) % |
150,014 |
130,288 |
15.1 % |
|||||
|
NET INCOME |
$ 111,228 |
$ 127,604 |
(12.8) % |
$ 502,776 |
$ 455,748 |
10.3 % |
|||||
|
Diluted earnings per share |
$ 1.57 |
$ 1.75 |
(10.2) % |
$ 6.98 |
$ 6.24 |
11.9 % |
|||||
- Effective tax rates for the fiscal three months and fiscal year ended
June 30, 2026 , were 20.4% and 23.0% respectively, and for the fiscal three months and fiscal year endedJune 30, 2025 were 20.2% and 22.2%, respectively.
|
According to |
|
6Operating margin is calculated by dividing operating income by revenue. Operating margin plus operating expense components as a percentage of total revenue may not equal 100% due to rounding. |
Impact of Non-GAAP Adjustments
The tables below show our revenue, operating income, and net income for the fiscal three months and fiscal year ended
|
(Unaudited, dollars in thousands) |
Three Months Ended |
% |
Year Ended |
% |
|||||||
|
2026 |
2025 |
2026 |
2025 |
||||||||
|
GAAP Revenue* |
$ 644,023 |
$ 615,372 |
4.7 % |
$ 2,544,339 |
$ 2,375,288 |
7.1 % |
|||||
|
Adjustments: |
|||||||||||
|
Deconversion revenue |
(9,327) |
(20,495) |
(42,830) |
(33,905) |
|||||||
|
Revenue related to a contract change |
— |
(1,202) |
— |
(15,874) |
|||||||
|
Revenue from the acquisition |
(1,598) |
— |
(5,193) |
— |
|||||||
|
NON-GAAP ADJUSTED REVENUE* |
$ 633,098 |
$ 593,675 |
6.6 % |
$ 2,496,316 |
$ 2,325,509 |
7.3 % |
|||||
|
GAAP Operating Income |
$ 136,773 |
$ 155,697 |
(12.2) % |
$ 635,033 |
$ 568,715 |
11.7 % |
|||||
|
Adjustments: |
|||||||||||
|
Operating income from deconversions |
(4,616) |
(17,938) |
(29,953) |
(27,663) |
|||||||
|
Operating income related to a contract change |
— |
(180) |
— |
(2,358) |
|||||||
|
Gain on assets, net |
— |
— |
(6,829) |
— |
|||||||
|
Operating loss from the acquisition |
1,141 |
— |
2,959 |
— |
|||||||
|
NON-GAAP ADJUSTED OPERATING INCOME |
$ 133,298 |
$ 137,579 |
(3.1) % |
$ 601,210 |
$ 538,694 |
11.6 % |
|||||
|
Non-GAAP Adjusted Operating Margin** |
21.1 % |
23.2 % |
24.1 % |
23.2 % |
|||||||
|
GAAP Net Income |
$ 111,228 |
$ 127,604 |
(12.8) % |
$ 502,776 |
$ 455,748 |
10.3 % |
|||||
|
Adjustments: |
|||||||||||
|
Net income from deconversions |
(4,616) |
(17,938) |
(29,953) |
(27,663) |
|||||||
|
Net income related to a contract change |
— |
(180) |
— |
(2,358) |
|||||||
|
Gain on assets, net |
— |
— |
(6,829) |
— |
|||||||
|
Net loss from the acquisition |
1,141 |
— |
2,959 |
— |
|||||||
|
Tax impact of adjustments*** |
834 |
4,348 |
8,118 |
7,205 |
|||||||
|
NON-GAAP ADJUSTED NET INCOME |
$ 108,587 |
$ 113,834 |
(4.6) % |
$ 477,071 |
$ 432,932 |
10.2 % |
|||||
|
*GAAP revenue is comprised of services and support and processing revenues (see page 2). Services and support revenue less deconversion revenue for the fiscal three months ended |
|
Services and support revenue less deconversion revenue for the fiscal year ended |
|
**Non-GAAP adjusted operating margin is calculated by dividing non-GAAP adjusted operating income by non-GAAP adjusted revenue. |
|
***The tax impact of adjustments is calculated using a tax rate of 24% for the fiscal three months and fiscal year ended |
The tables below show the segment break-out of revenue and cost of revenue for each period presented, as adjusted for the items above, and include a reconciliation to non-GAAP adjusted operating income presented above.
|
Three Months Ended |
|||||||||
|
(Unaudited, dollars in thousands) |
Core |
Payments |
Complementary |
Corporate |
Total |
||||
|
GAAP REVENUE |
$ 191,611 |
$ 240,419 |
$ 188,800 |
$ 23,193 |
$ 644,023 |
||||
|
Non-GAAP adjustments* |
(2,830) |
(4,454) |
(3,588) |
(53) |
(10,925) |
||||
|
NON-GAAP ADJUSTED REVENUE |
188,781 |
235,965 |
185,212 |
23,140 |
633,098 |
||||
|
GAAP COST OF REVENUE |
75,756 |
121,233 |
73,009 |
100,177 |
370,175 |
||||
|
Non-GAAP adjustments* |
(1,450) |
(2,295) |
(1,040) |
(129) |
(4,914) |
||||
|
NON-GAAP ADJUSTED COST OF REVENUE |
74,306 |
118,938 |
71,969 |
100,048 |
365,261 |
||||
|
GAAP SEGMENT INCOME |
$ 115,855 |
$ 119,186 |
$ 115,791 |
$ (76,984) |
|||||
|
Segment Income Margin** |
60.5 % |
49.6 % |
61.3 % |
(331.9) % |
|||||
|
NON-GAAP ADJUSTED SEGMENT INCOME |
$ 114,475 |
$ 117,027 |
$ 113,243 |
$ (76,908) |
|||||
|
Non-GAAP Adjusted Segment Income Margin** |
60.6 % |
49.6 % |
61.1 % |
(332.4) % |
|||||
|
Research and Development |
49,830 |
||||||||
|
Selling, General, and Administrative |
87,245 |
||||||||
|
Non-GAAP adjustments unassigned to a segment*** |
(2,536) |
||||||||
|
NON-GAAP TOTAL ADJUSTED OPERATING EXPENSES |
499,800 |
||||||||
|
NON-GAAP ADJUSTED OPERATING INCOME |
$ 133,298 |
||||||||
|
*Revenue non-GAAP adjustments for the Payments segment were ( |
|
**Segment income margin is calculated by dividing segment income by revenue for each segment. Non-GAAP adjusted segment income margin is calculated by dividing non-GAAP adjusted segment income by non-GAAP adjusted revenue for each segment. |
|
***Non-GAAP adjustments unassigned to a segment were deconversion costs of |
|
Three Months Ended |
|||||||||
|
(Unaudited, dollars in thousands) |
Core |
Payments |
Complementary |
Corporate |
Total |
||||
|
GAAP REVENUE |
$ 187,976 |
$ 229,292 |
$ 180,317 |
$ 17,787 |
$ 615,372 |
||||
|
Non-GAAP adjustments* |
(9,863) |
(6,818) |
(4,852) |
(164) |
(21,697) |
||||
|
NON-GAAP ADJUSTED REVENUE |
178,113 |
222,474 |
175,465 |
17,623 |
593,675 |
||||
|
GAAP COST OF REVENUE |
69,389 |
116,128 |
68,894 |
89,468 |
343,879 |
||||
|
Non-GAAP adjustments* |
(1,753) |
(109) |
(440) |
(9) |
(2,311) |
||||
|
NON-GAAP ADJUSTED COST OF REVENUE |
67,636 |
116,019 |
68,454 |
89,459 |
341,568 |
||||
|
GAAP SEGMENT INCOME |
$ 118,587 |
$ 113,164 |
$ 111,423 |
$ (71,681) |
|||||
|
Segment Income Margin** |
63.1 % |
49.4 % |
61.8 % |
(403.0) % |
|||||
|
NON-GAAP ADJUSTED SEGMENT INCOME |
$ 110,477 |
$ 106,455 |
$ 107,011 |
$ (71,836) |
|||||
|
Non-GAAP Adjusted Segment Income Margin |
62.0 % |
47.9 % |
61.0 % |
(407.6) % |
|||||
|
Research and Development |
42,580 |
||||||||
|
Selling, General, and Administrative |
73,216 |
||||||||
|
Non-GAAP adjustments unassigned to a segment*** |
(1,268) |
||||||||
|
NON-GAAP TOTAL ADJUSTED OPERATING EXPENSES |
456,096 |
||||||||
|
NON-GAAP ADJUSTED OPERATING INCOME |
$ 137,579 |
||||||||
|
*Revenue non-GAAP adjustments for the Core segment were ( |
|
**Segment income margin is calculated by dividing segment income by revenue for each segment. Non-GAAP adjusted segment income margin is calculated by dividing non-GAAP adjusted segment income by non-GAAP adjusted revenue for each segment. |
|
***Non-GAAP adjustments unassigned to a segment were deconversion costs. |
|
Year Ended |
|||||||||
|
(Unaudited, dollars in thousands) |
Core |
Payments |
Complementary |
Corporate |
Total |
||||
|
GAAP REVENUE |
$ 768,452 |
$ 936,006 |
$ 752,214 |
$ 87,667 |
$ 2,544,339 |
||||
|
Non-GAAP adjustments* |
(16,605) |
(18,853) |
(12,219) |
(346) |
(48,023) |
||||
|
NON-GAAP ADJUSTED REVENUE |
751,847 |
917,153 |
739,995 |
87,321 |
2,496,316 |
||||
|
GAAP COST OF REVENUE |
304,886 |
479,539 |
286,726 |
362,500 |
1,433,651 |
||||
|
Non-GAAP adjustments* |
(4,566) |
(6,571) |
(2,119) |
(389) |
(13,645) |
||||
|
NON-GAAP ADJUSTED COST OF REVENUE |
300,320 |
472,968 |
284,607 |
362,111 |
1,420,006 |
||||
|
GAAP SEGMENT INCOME |
$ 463,566 |
$ 456,467 |
$ 465,488 |
$ (274,833) |
|||||
|
Segment Income Margin** |
60.3 % |
48.8 % |
61.9 % |
(313.5) % |
|||||
|
NON-GAAP ADJUSTED SEGMENT INCOME |
$ 451,527 |
$ 444,185 |
$ 455,388 |
$ (274,790) |
|||||
|
Non-GAAP Adjusted Segment Income Margin |
60.1 % |
48.4 % |
61.5 % |
(314.7) % |
|||||
|
Research and Development |
176,445 |
||||||||
|
Selling, General, and Administrative |
299,210 |
||||||||
|
Non-GAAP adjustments unassigned to a segment*** |
(555) |
||||||||
|
NON-GAAP TOTAL ADJUSTED OPERATING EXPENSES |
1,895,106 |
||||||||
|
NON-GAAP ADJUSTED OPERATING INCOME |
$ 601,210 |
||||||||
|
*Revenue non-GAAP adjustments for the Payments segment were ( |
|
**Segment income margin is calculated by dividing segment income by revenue for each segment. Non-GAAP adjusted segment income margin is calculated by dividing non-GAAP adjusted segment income by non-GAAP adjusted revenue for each segment. |
|
***Non-GAAP adjustments unassigned to a segment were a gain on assets, net, of |
|
Year Ended |
|||||||||
|
(Unaudited, dollars in thousands) |
Core |
Payments |
Complementary |
Corporate |
Total |
||||
|
GAAP REVENUE |
$ 732,924 |
$ 873,498 |
$ 694,771 |
$ 74,095 |
$ 2,375,288 |
||||
|
Non-GAAP adjustments* |
(30,639) |
(11,159) |
(7,709) |
(272) |
(49,779) |
||||
|
NON-GAAP ADJUSTED REVENUE |
702,285 |
862,339 |
687,062 |
73,823 |
2,325,509 |
||||
|
GAAP COST OF REVENUE |
295,239 |
460,151 |
269,657 |
335,700 |
1,360,747 |
||||
|
Non-GAAP adjustments* |
(15,612) |
(288) |
(1,119) |
(14) |
(17,033) |
||||
|
NON-GAAP ADJUSTED COST OF REVENUE |
279,627 |
459,863 |
268,538 |
335,686 |
1,343,714 |
||||
|
GAAP SEGMENT INCOME |
$ 437,685 |
$ 413,347 |
$ 425,114 |
$ (261,605) |
|||||
|
Segment Income Margin** |
59.7 % |
47.3 % |
61.2 % |
(353.1) % |
|||||
|
NON-GAAP ADJUSTED SEGMENT INCOME |
$ 422,658 |
$ 402,476 |
$ 418,524 |
$ (261,863) |
|||||
|
Non-GAAP Adjusted Segment Income Margin |
60.2 % |
46.7 % |
60.9 % |
(354.7) % |
|||||
|
Research and Development |
162,771 |
||||||||
|
Selling, General, and Administrative |
283,055 |
||||||||
|
Non-GAAP adjustments unassigned to a segment*** |
(2,725) |
||||||||
|
NON-GAAP TOTAL ADJUSTED OPERATING EXPENSES |
1,786,815 |
||||||||
|
NON-GAAP ADJUSTED OPERATING INCOME |
$ 538,694 |
||||||||
|
*Revenue non-GAAP adjustments for the Core segment were ( |
|
**Segment income margin is calculated by dividing segment income by revenue for each segment. Non-GAAP adjusted segment income margin is calculated by dividing non-GAAP adjusted segment income by non-GAAP adjusted revenue for each segment. |
|
***Non-GAAP adjustments unassigned to a segment were deconversion costs. |
The table below shows our GAAP to non-GAAP guidance for the fiscal year ending
|
GAAP to Non-GAAP GUIDANCE (Dollars in |
Annual FY'27 |
Adjusted for |
Reported |
Change |
|||||||
|
Low |
High |
FY26 |
FY26 |
FY26 |
|||||||
|
GAAP REVENUE |
$ 2,684 |
$ 2,709 |
$ 2,544 |
$ 2,544 |
$ — |
||||||
|
Growth |
5.5 % |
6.5 % |
|||||||||
|
Deconversions* |
23 |
23 |
43 |
43 |
— |
||||||
|
Acquisition |
2 |
2 |
— |
5 |
(5) |
||||||
|
NON-GAAP ADJUSTED REVENUE** |
$ 2,659 |
$ 2,684 |
$ 2,502 |
$ 2,496 |
$ 5 |
||||||
|
Non-GAAP Adjusted Growth |
6.3 % |
7.3 % |
|||||||||
|
GAAP OPERATING EXPENSES |
$ 2,025 |
$ 2,039 |
$ 1,909 |
$ 1,909 |
$ — |
||||||
|
Growth |
6.1 % |
6.8 % |
|||||||||
|
Deconversion costs* |
5 |
5 |
13 |
13 |
— |
||||||
|
Acquisition costs |
3 |
3 |
— |
8 |
(8) |
||||||
|
Gain on assets, net |
— |
— |
(7) |
(7) |
— |
||||||
|
NON-GAAP ADJUSTED OPERATING EXPENSES** |
$ 2,018 |
$ 2,031 |
$ 1,903 |
$ 1,895 |
$ 8 |
||||||
|
Non-GAAP Adjusted Growth |
6.0 % |
6.7 % |
|||||||||
|
GAAP OPERATING INCOME |
$ 658 |
$ 670 |
$ 635 |
$ 635 |
$ — |
||||||
|
Growth |
3.7 % |
5.5 % |
|||||||||
|
GAAP OPERATING MARGIN |
24.5 % |
24.7 % |
25.0 % |
25.0 % |
|||||||
|
NON-GAAP ADJUSTED OPERATING INCOME** |
$ 641 |
$ 653 |
$ 598 |
$ 601 |
$ (3) |
||||||
|
Non-GAAP Adjusted Growth |
7.2 % |
9.1 % |
|||||||||
|
NON-GAAP ADJUSTED OPERATING MARGIN |
24.1 % |
24.3 % |
23.9 % |
24.1 % |
|||||||
|
GAAP EPS |
$ 7.33 |
$ 7.38 |
$ 6.98 |
$ 6.98 |
$ — |
||||||
|
Growth |
5.0 % |
5.7 % |
|||||||||
|
*Deconversion revenue and related operating expenses for fiscal year 2027 are based on the lowest actual recent historical results. See the Company's Form 8-K filed with the Securities and Exchange Commission on |
|
**GAAP to Non-GAAP revenue, operating expenses, and operating income may not foot due to rounding. |
Balance Sheet and Cash Flow Review
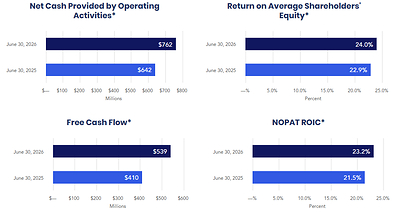
- Cash and cash equivalents were
$12 million atJune 30, 2026 , compared to$102 million atJune 30, 2025 . - Trade receivables were
$349 million atJune 30, 2026 , and$318 million atJune 30, 2025 . - The Company had
$40 million of borrowings atJune 30, 2026 , compared to$0 of borrowings atJune 30, 2025 . - Deferred revenue was
$372 million atJune 30, 2026 , compared to$363 million atJune 30, 2025 . - Stockholders' equity decreased to
$2,052 million atJune 30, 2026 , compared to$2,131 million atJune 30, 2025 .
|
*See table below for Net Cash Provided by Operating Activities and on page 14 for Return on Average Stockholders' Equity. Tables reconciling the non-GAAP measures Free Cash Flow and Net Operating Profit After Tax Return on |
The following table summarizes net cash from operating activities:
|
(Unaudited, in thousands) |
Year Ended |
||
|
2026 |
2025 |
||
|
Net income |
$ 502,776 |
$ 455,748 |
|
|
Depreciation |
42,103 |
43,700 |
|
|
Amortization |
171,138 |
161,051 |
|
|
Change in deferred income taxes |
126,032 |
(3,496) |
|
|
Other non-cash expenses |
35,023 |
30,358 |
|
|
Change in receivables |
(29,268) |
15,056 |
|
|
Change in deferred revenue |
9,099 |
(25,559) |
|
|
Change in other assets and liabilities* |
(94,943) |
(35,354) |
|
|
NET CASH FROM OPERATING ACTIVITIES |
$ 761,960 |
$ 641,504 |
|
|
*For the fiscal year ended |
The following table summarizes net cash from investing activities:
|
(Unaudited, in thousands) |
Year Ended |
||
|
2026 |
2025 |
||
|
Payment for acquisitions |
$ (42,390) |
$ — |
|
|
Capital expenditures |
(67,103) |
(53,358) |
|
|
Proceeds from sale of assets |
32,827 |
3 |
|
|
Purchased software |
(4,108) |
(5,363) |
|
|
Computer software developed |
(184,243) |
(172,445) |
|
|
Purchase of investments |
(13,721) |
(2,000) |
|
|
Proceeds from investments |
1,000 |
1,000 |
|
|
NET CASH FROM INVESTING ACTIVITIES |
$ (277,738) |
$ (232,163) |
|
The following table summarizes net cash from financing activities:
|
(Unaudited, in thousands) |
Year Ended |
||
|
2026 |
2025 |
||
|
Borrowings on credit facilities |
$ 480,000 |
$ 350,000 |
|
|
Repayments on credit facilities |
(440,000) |
(500,000) |
|
|
Purchase of treasury stock |
(448,173) |
(35,051) |
|
|
Dividends paid |
(170,405) |
(164,644) |
|
|
Net cash from issuance of stock and tax related to stock-based |
4,459 |
4,023 |
|
|
NET CASH FROM FINANCING ACTIVITIES |
$ (574,119) |
$ (345,672) |
|
Use of Non-GAAP Financial Information
Generally Accepted Accounting Principles (GAAP) is the term used to refer to the standard framework of guidelines for financial accounting in
We believe non-GAAP financial measures help investors better understand the underlying fundamentals and true operations of our business. Adjusted revenue, adjusted segment revenue, adjusted operating income, adjusted operating margin, adjusted segment income, adjusted segment income margin, adjusted cost of revenue, adjusted segment cost of revenue, adjusted operating expenses, and adjusted net income eliminate deconversion revenue and associated costs, the gain on assets, net, an acquisition, and a contractual change, which management believes are not indicative of the Company's operating performance. Such adjustments give investors further insight into our performance. Non-GAAP EBITDA is defined as net income attributable to the Company before the effect of interest income, net, taxes, depreciation, and amortization, adjusted for net income before the effect of interest income, net, taxes, depreciation, and amortization attributable to eliminated deconversions, the gain on assets, net, an acquisition, and a contractual change. Free cash flow is defined as net cash from operating activities, less capitalized expenditures, internal use software, and capitalized software, plus proceeds from the sale of assets. NOPAT ROIC is defined as operating income for the trailing four quarters multiplied by one minus the average effective tax rate (ETR) for the trailing four quarters, with the result divided by average invested capital (average of the beginning and ending period balances). Management believes that non-GAAP EBITDA is an important measure of the Company's overall operating performance and excludes certain costs and other transactions that management deems one time or non-operational in nature; free cash flow is useful to measure the funds generated in a given period that are available for debt service requirements and strategic capital decisions; and NOPAT ROIC is a measure of the Company's allocation efficiency and effectiveness of its invested capital. For these reasons, management also uses these non-GAAP financial measures in its assessment and management of the Company's performance.
Non-GAAP financial measures used by the Company may not be comparable to similarly titled non-GAAP measures used by other companies. Non-GAAP financial measures have no standardized meaning prescribed by GAAP and therefore, are unlikely to be comparable with calculations of similar measures for other companies.
Any non-GAAP financial measures should be considered in context with the GAAP financial presentation and should not be considered in isolation or as a substitute for GAAP measures. Reconciliations of the non-GAAP financial measures to related GAAP measures are included.
About Jack Henry & Associates, Inc.®
Jack Henry® (Nasdaq: JKHY) is a well-rounded financial technology company that strengthens connections between financial institutions and the people and businesses they serve. We are an S&P 500 company that prioritizes openness, collaboration, and user centricity — offering banks and credit unions a vibrant ecosystem of internally developed modern capabilities as well as the ability to integrate with leading fintechs. For 50 years, Jack Henry has provided technology solutions to enable clients to innovate faster, strategically differentiate, and successfully compete while serving the evolving needs of their accountholders. We empower over 7,200 clients with people-inspired innovation, personal service, and insight-driven solutions that help reduce the barriers to financial health. Additional information is available at www.jackhenry.com.
Quarterly Conference Call
The Company will hold a conference call on August 19, 2026, at 7:45 a.m. Central Time, and investors are invited to listen at www.jackhenry.com. A webcast replay will be available approximately one hour after the event at ir.jackhenry.com/corporate-events-and-presentations and will remain available for one year.
Statements made in this news release that are not historical facts are "forward-looking statements" within the meaning of the Private Securities Litigation Reform Act of 1995, Section 27A of the Securities Act of 1933 and Section 21E of the Securities Exchange Act of 1934. Because forward-looking statements relate to the future, they are subject to inherent risks and uncertainties that could cause actual results to differ materially from those expressed or implied by such statements. Such risks and uncertainties include, but are not limited to, those discussed in the Company's Securities and Exchange Commission filings, including the Company's most recent reports on Form 10-K and Form 10-Q, particularly under the heading Risk Factors. Any forward-looking statement made in this news release speaks only as of the date of the news release, and the Company expressly disclaims any obligation to publicly update or revise any forward-looking statement, whether because of new information, future events or otherwise.
|
Consolidated Statements of Income (Unaudited) |
|||||||||||
|
(Dollars in thousands, except per share data) |
Three Months Ended |
% |
Year Ended |
% |
|||||||
|
2026 |
2025 |
2026 |
2025 |
||||||||
|
REVENUE |
$ 644,023 |
$ 615,372 |
4.7 % |
$ 2,544,339 |
$ 2,375,288 |
7.1 % |
|||||
|
Cost of Revenue |
370,175 |
343,879 |
7.6 % |
1,433,651 |
1,360,747 |
5.4 % |
|||||
|
Research and Development |
49,830 |
42,580 |
17.0 % |
176,445 |
162,771 |
8.4 % |
|||||
|
Selling, General, and Administrative |
87,245 |
73,216 |
19.2 % |
299,210 |
283,055 |
5.7 % |
|||||
|
EXPENSES |
507,250 |
459,675 |
10.3 % |
1,909,306 |
1,806,573 |
5.7 % |
|||||
|
OPERATING INCOME |
136,773 |
155,697 |
(12.2) % |
635,033 |
568,715 |
11.7 % |
|||||
|
Interest income |
4,949 |
6,354 |
(22.1) % |
23,144 |
27,759 |
(16.6) % |
|||||
|
Interest expense |
(1,984) |
(2,102) |
(5.6) % |
(5,387) |
(10,438) |
(48.4) % |
|||||
|
Interest Income, net |
2,965 |
4,252 |
(30.3) % |
17,757 |
17,321 |
2.5 % |
|||||
|
INCOME BEFORE INCOME TAXES |
139,738 |
159,949 |
(12.6) % |
652,790 |
586,036 |
11.4 % |
|||||
|
Provision for Income Taxes |
28,510 |
32,345 |
(11.9) % |
150,014 |
130,288 |
15.1 % |
|||||
|
NET INCOME |
$ 111,228 |
$ 127,604 |
(12.8) % |
$ 502,776 |
$ 455,748 |
10.3 % |
|||||
|
Diluted net income per share |
$ 1.57 |
$ 1.75 |
$ 6.98 |
$ 6.24 |
|||||||
|
Diluted weighted average shares outstanding |
70,872 |
73,005 |
72,043 |
73,045 |
|||||||
|
Consolidated Balance Sheet Highlights (Unaudited) |
|||||||||||
|
(In thousands) |
|
% |
|||||||||
|
2026 |
2025 |
||||||||||
|
Cash and cash equivalents |
$ 12,056 |
$ 101,953 |
(88.2) % |
||||||||
|
Receivables |
349,111 |
317,977 |
9.8 % |
||||||||
|
Total assets |
3,145,711 |
3,043,970 |
3.3 % |
||||||||
|
Accounts payable and accrued expenses |
$ 261,476 |
$ 245,299 |
6.6 % |
||||||||
|
Debt |
40,000 |
— |
— % |
||||||||
|
Deferred revenue |
372,472 |
363,374 |
2.5 % |
||||||||
|
Stockholders' equity |
2,051,949 |
2,130,832 |
(3.7) % |
||||||||
|
Calculation of Non-GAAP Earnings Before Interest Income, Net, Income Taxes, Depreciation and Amortization (Non-GAAP EBITDA) |
|||||||||||
|
Three Months Ended |
% |
Year Ended |
% |
||||||||
|
(Dollars in thousands) |
2026 |
2025 |
2026 |
2025 |
|||||||
|
Net income |
$ 111,228 |
$ 127,604 |
$ 502,776 |
$ 455,748 |
|||||||
|
Net interest |
(2,965) |
(4,252) |
(17,757) |
(17,321) |
|||||||
|
Taxes |
28,510 |
32,345 |
150,013 |
130,288 |
|||||||
|
Depreciation and amortization |
54,541 |
51,490 |
213,241 |
204,751 |
|||||||
|
Less: Net income before interest expense, |
(3,954) |
(18,118) |
(35,244) |
(30,021) |
|||||||
|
NON-GAAP EBITDA |
$ 187,360 |
$ 189,069 |
(0.9) % |
$ 813,029 |
$ 743,445 |
9.4 % |
|||||
|
*The fiscal fourth quarter 2026 and 2025 adjustments for net income before interest expense, taxes, depreciation and amortization were for deconversions of ( |
|||||||||||
|
Calculation of Free Cash Flow (Non-GAAP) |
Year Ended |
||||||||||
|
(In thousands) |
2026 |
2025 |
|||||||||
|
Net cash from operating activities |
$ 761,960 |
$ 641,504 |
|||||||||
|
Capitalized expenditures |
(67,103) |
(53,358) |
|||||||||
|
Internal use software |
(4,108) |
(5,363) |
|||||||||
|
Proceeds from sale of assets |
32,827 |
3 |
|||||||||
|
Capitalized software |
(184,243) |
(172,445) |
|||||||||
|
FREE CASH FLOW |
$ 539,333 |
$ 410,341 |
|||||||||
|
Net income |
$ 502,776 |
$ 455,748 |
|||||||||
|
Operating cash conversion* |
151.6 % |
140.8 % |
|||||||||
|
Free cash flow conversion (excluding proceeds from sale of assets)* |
100.7 % |
90.0 % |
|||||||||
|
*Operating cash conversion is net cash from operating activities divided by net income. Free cash flow conversion is free cash flow less proceeds from sale of |
|||||||||||
|
Calculation of the Return on Average Stockholders' Equity |
|
||||||||||
|
(In thousands) |
2026 |
2025 |
|||||||||
|
Net income (trailing four quarters) |
$ 502,776 |
$ 455,748 |
|||||||||
|
Average stockholder's equity (period beginning and ending balances) |
2,091,391 |
1,986,598 |
|||||||||
|
RETURN ON AVERAGE STOCKHOLDERS' EQUITY |
24.0 % |
22.9 % |
|||||||||
|
Calculation of NOPAT ROIC (Non-GAAP) |
|
||||||||||
|
(In thousands) |
2026 |
2025 |
|||||||||
|
Operating income (trailing four quarters) |
$ 635,033 |
$ 568,715 |
|||||||||
|
Average Effective Tax Rate (trailing four quarters) |
22.8 % |
22.2 % |
|||||||||
|
NOPAT operating income (trailing four quarters)* |
490,245 |
442,460 |
|||||||||
|
Average invested capital (period beginning and ending balances) |
2,111,391 |
2,061,598 |
|||||||||
|
NOPAT ROIC |
23.2 % |
21.5 % |
|||||||||
|
*NOPAT operating income is calculated by multiplying the trailing four quarters operating income by one minus the average ETR. NOPAT ROIC is calculated by dividing NOPAT operating income by average invested capital (period beginning and ending balances). |
FAQ for Analysts / Investors
1. Why does fiscal 2025 non-GAAP revenue used for growth calculation not match reported fiscal 2025 non-GAAP revenue?
- The restructuring of a third-party agreement resulted in a
$16 million fiscal year-over-year revenue headwind, with$12 million of that in the first quarter and$4 million additional in the second, third, and fourth quarters. - This restructuring also resulted in a decrease in the related costs and the impact on margins was minimal.
- This was adjusted for a consistent fiscal year-over-year comparison.
2. What will be the impact of the Victor acquisition in fiscal year 2027?
- With the one-year anniversary of the acquisition rolling off on
September 30, 2026 , Victor's ongoing revenue will be fully integrated into Non-GAAP adjusted (organic) revenue startingOctober 1, 2026 .
 View original content to download multimedia:https://www.prnewswire.com/news-releases/jack-henry--associates-inc-reports-fourth-quarter-and-full-year-fiscal-2026-results-302854537.html
SOURCE
MEDIA CONTACT: Jeremy Elwood, Corporate Communications, Jack Henry & Associates, Inc., 417-235-6652, JDElwood@jackhenry.com or ANALYST CONTACT: Vance Sherard, CFA, Investor Relations, Jack Henry & Associates, Inc., 417-235-6652, VSherard@jackhenry.com
