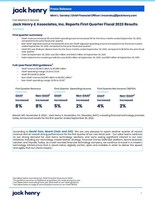
First quarter summary:
- GAAP revenue increased 8% and GAAP operating income increased 5% for the three months ended
September 30, 2022 , compared to the prior fiscal year quarter. - Non-GAAP adjusted revenue increased 8% and non-GAAP adjusted operating income increased 2% for the three months ended
September 30, 2022 , compared to the prior fiscal year quarter.1 - GAAP EPS was
$1.46 per diluted share for the three months endedSeptember 30, 2022 , compared to$1.38 for the prior fiscal year quarter. - Cash at
September 30, 2022 , was$32 million and$44.3 million atSeptember 30, 2021 . - Debt related to the revolving credit line was
$245 million atSeptember 30, 2022 , and$65 million atSeptember 30, 2021 .
Full-year fiscal 2023 guidance:2
- GAAP revenue
$2,092 million to$2,099 million - GAAP operating margin 23.2% to 23.3%
- GAAP EPS
$4.90 to$4.94 - Non-GAAP revenue
$2,045 million to$2,052 million 3 - Non-GAAP operating margin 22.5% to 22.6%3

|
According to |
1 See tables below reconciling non-GAAP financial measures to GAAP.
2 The guidance assumes no additional acquisitions are made during the year.
3 See tables below reconciling fiscal year 2023 GAAP to non-GAAP guidance.
4 See tables below on page 10 reconciling Net Income to non-GAAP EBITDA.
Operating Results
Revenue, operating expenses, operating income, and net income for the three months ended
|
Revenue (Unaudited) |
|||||
|
(In Thousands) |
Three Months Ended |
% |
|||
|
2022 |
2021 |
||||
|
Revenue |
|||||
|
Services and Support |
$ 320,149 |
$ 297,494 |
8 % |
||
|
Percentage of Total Revenue |
60 % |
61 % |
|||
|
Processing |
209,053 |
190,562 |
10 % |
||
|
Percentage of Total Revenue |
40 % |
39 % |
|||
|
REVENUE |
$ 529,202 |
$ 488,056 |
8 % |
||
- Services and support revenue increased for first quarter fiscal 2023 primarily driven by growth in cloud processing revenue of 11%. Other drivers were increases in software usage, implementation fee, and user group revenues. Processing revenue increased for the first quarter fiscal 2023 primarily driven by growth in card processing revenue of 8%. Other drivers were increases in Jack Henry digital revenue and payment processing, including iPay.
- For first quarter fiscal 2023, core segment revenue increased 6%, payments segment revenue increased 8%, complementary segment revenue increased 8%, and corporate and other segment revenue increased 55%. Non-GAAP adjusted core segment revenue increased 6%, non-GAAP adjusted payments segment revenue increased 7%, non-GAAP adjusted complementary segment revenue increased 8%, and non-GAAP adjusted corporate and other segment revenue increased 55% (see revenue lines of segment break-out tables on page 4 below).
Operating Expenses and Operating Income
|
(Unaudited, In Thousands) |
Three Months Ended |
% |
|||
|
2022 |
2021 |
||||
|
Cost of Revenue |
$ 298,261 |
$ 276,636 |
8 % |
||
|
Percentage of Total Revenue |
56 % |
57 % |
|||
|
Research and Development |
32,993 |
26,754 |
23 % |
||
|
Percentage of Total Revenue |
6 % |
5 % |
|||
|
Selling, General, and Administrative |
57,225 |
51,071 |
12 % |
||
|
Percentage of Total Revenue |
11 % |
10 % |
|||
|
OPERATING EXPENSES |
388,479 |
354,461 |
10 % |
||
|
OPERATING INCOME |
$ 140,723 |
$ 133,595 |
5 % |
||
|
Operating Margin5 |
27 % |
27 % |
|||
- Cost of revenue increased for first quarter fiscal 2023 primarily due to higher costs associated with our card processing third-party platform approximately in line with related increases in revenue, higher personnel costs, higher internal licenses and fees, and increased amortization of intangibles, partially offset by a decrease for labor cost deferrals.
- Research and development expense increased for first quarter fiscal 2023 primarily due to higher personnel costs (net of capitalized personnel costs).
- Selling, general, and administrative expense increased for the first quarter fiscal 2023 primarily due to higher travel expenses, increased personnel costs, higher consulting and other professional services, and an increase in meetings and trainings, partially offset by the increase in the gain on sale of assets.
5 Operating margin is calculated by dividing operating income by revenue.
Net Income
|
(Unaudited, In Thousands, Except Per Share Data) |
Three Months Ended |
% |
|||
|
2022 |
2021 |
||||
|
Income Before Income Taxes |
$ 139,299 |
$ 133,354 |
4 % |
||
|
Provision for Income Taxes |
32,750 |
31,240 |
5 % |
||
|
NET INCOME |
$ 106,549 |
$ 102,114 |
4 % |
||
|
Diluted earnings per share |
$ 1.46 |
$ 1.38 |
6 % |
||
- Effective tax rates for the first quarter of fiscal years 2023 and 2022 were 23.5% and 23.4%, respectively.
|
According to |
Impact of Non-GAAP Adjustments
The table below shows our revenue and operating income (in thousands) for the three months ended
|
(Unaudited, In Thousands) |
Three Months Ended |
% |
|||
|
2022 |
2021 |
||||
|
Revenue (GAAP) |
$ 529,202 |
$ 488,056 |
8 % |
||
|
Adjustments: |
|||||
|
Deconversion fee revenue |
(4,518) |
(3,724) |
|||
|
Revenue from acquisitions |
(738) |
— |
|||
|
NON-GAAP ADJUSTED REVENUE |
$ 523,946 |
$ 484,332 |
8 % |
||
|
Operating Income (GAAP) |
$ 140,723 |
$ 133,595 |
5 % |
||
|
Adjustments: |
|||||
|
Operating income from deconversion fees |
(3,865) |
(3,184) |
|||
|
Operating income from acquisitions |
1,797 |
— |
|||
|
Gain on disposal of assets, net |
(6,176) |
— |
|||
|
NON-GAAP ADJUSTED OPERATING INCOME |
$ 132,479 |
$ 130,411 |
2 % |
||
The tables below show the segment break-out of revenue and cost of revenue for each period presented, as adjusted for the items above, and include a reconciliation to non-GAAP adjusted operating income presented above.
|
(Unaudited, In Thousands) |
Three Months Ended |
||||||||
|
Core |
Payments |
Complementary |
Corporate |
Total |
|||||
|
REVENUE |
$ 175,124 |
$ 186,540 |
$ 148,350 |
$ 19,188 |
$ 529,202 |
||||
|
Non-GAAP adjustments* |
(1,818) |
(2,173) |
(1,235) |
(30) |
(5,256) |
||||
|
NON-GAAP ADJUSTED REVENUE |
173,306 |
184,367 |
147,115 |
19,158 |
523,946 |
||||
|
COST OF REVENUE |
72,240 |
101,155 |
58,437 |
66,429 |
298,261 |
||||
|
Non-GAAP adjustments** |
(140) |
(1,603) |
(199) |
(7) |
(1,949) |
||||
|
NON-GAAP ADJUSTED COST OF REVENUE |
72,100 |
99,552 |
58,238 |
66,422 |
296,312 |
||||
|
NON-GAAP ADJUSTED SEGMENT INCOME |
$ 101,206 |
$ 84,815 |
$ 88,877 |
$ (47,264) |
|||||
|
Research and Development |
32,993 |
||||||||
|
Selling, General, and Administrative |
57,225 |
||||||||
|
Non-GAAP adjustments unassigned to a segment |
4,937 |
||||||||
|
NON-GAAP TOTAL ADJUSTED OPERATING EXPENSES |
391,467 |
||||||||
|
NON-GAAP ADJUSTED OPERATING INCOME |
$ 132,479 |
||||||||
*See page 3 for breakdown of revenue non-GAAP adjustments.
**Cost of revenue non-GAAP adjustments were
|
(Unaudited, In Thousands) |
Three Months Ended |
||||||||
|
Core |
Payments |
Complementary |
Corporate |
Total |
|||||
|
REVENUE (GAAP) |
$ 165,285 |
$ 172,591 |
$ 137,778 |
$ 12,402 |
$ 488,056 |
||||
|
Non-GAAP adjustments* |
(2,168) |
(448) |
(1,097) |
(11) |
(3,724) |
||||
|
NON-GAAP ADJUSTED REVENUE |
163,117 |
172,143 |
136,681 |
12,391 |
484,332 |
||||
|
COST OF REVENUE |
66,902 |
94,582 |
54,417 |
60,735 |
276,636 |
||||
|
Non-GAAP adjustments |
(138) |
(45) |
(153) |
(2) |
(338) |
||||
|
NON-GAAP ADJUSTED COST OF REVENUE |
66,764 |
94,537 |
54,264 |
60,733 |
276,298 |
||||
|
NON-GAAP ADJUSTED SEGMENT INCOME |
$ 96,353 |
$ 77,606 |
$ 82,417 |
$ (48,342) |
|||||
|
Research and Development |
26,754 |
||||||||
|
Selling, General, and Administrative |
51,071 |
||||||||
|
Non-GAAP adjustments unassigned to a segment |
(202) |
||||||||
|
NON-GAAP TOTAL ADJUSTED OPERATING EXPENSES |
353,921 |
||||||||
|
NON-GAAP ADJUSTED OPERATING INCOME |
$ 130,411 |
||||||||
*See page 3 for breakdown of revenue non-GAAP adjustments.
The table below shows our GAAP to non-GAAP guidance for fiscal 2023.. Non-GAAP guidance excludes the impacts of deconversion fee and acquisition revenue and operating expenses.
|
GAAP to Non-GAAP GUIDANCE (In Millions, except |
Annual FY23 |
||||
|
Low |
High |
||||
|
REVENUE (GAAP) |
|
|
|||
|
Growth |
7.7 % |
8.0 % |
|||
|
Deconversion fee |
$ 35 |
$ 35 |
|||
|
Acquisition |
12 |
12 |
|||
|
NON-GAAP ADJUSTED REVENUE |
|
|
|||
|
Non-GAAP Adjusted Growth |
8.2 % |
8.6 % |
|||
|
OPERATING EXPENSES (GAAP) |
|
$ 1,611 |
|||
|
Growth |
9.5 % |
9.7 % |
|||
|
Deconversion costs |
$ 5 |
$ 5 |
|||
|
Acquisition costs |
23 |
23 |
|||
|
Gain on disposal of assets, net |
(6) |
(6) |
|||
|
NON-GAAP ADJUSTED OPERATING EXPENSES |
|
|
|||
|
Non-GAAP Adjusted Growth |
8.5 % |
8.7 % |
|||
|
OPERATING INCOME (GAAP) |
$ 485 |
$ 488 |
|||
|
Growth |
2.1 % |
2.9 % |
|||
|
OPERATING INCOME MARGIN (GAAP) |
23.2 % |
23.3 % |
|||
|
NON-GAAP ADJUSTED OPERATING INCOME |
$ 460 |
$ 463 |
|||
|
Non-GAAP Adjusted Growth |
7.5 % |
8.3 % |
|||
|
NON-GAAP ADJUSTED OPERATING INCOME MARGIN |
22.5 % |
22.6 % |
|||
|
EPS (GAAP) |
$ 4.90 |
$ 4.94 |
|||
|
Growth |
(0.8) % |
(0.1) % |
|||
Balance Sheet and Cash Flow Review

- At
September 30, 2022 , cash and cash equivalents decreased to$32 million from$44.3 million atSeptember 30, 2021 . - Trade receivables totaled
$247.5 million atSeptember 30, 2022 , compared to$253.2 million atSeptember 30, 2021 . - The Company had
$245 million of borrowings atSeptember 30, 2022 , and$65 million atSeptember 30, 2021 . - Total deferred revenue increased to
$345.1 million atSeptember 30, 2022 , compared to$334.9 million a year ago. - Stockholders' equity increased to
$1,461.1 million atSeptember 30, 2022 , compared to$1,395.7 million a year ago.
*See table below for Net Cash Provided by Operating Activities and on page 10 for Return on Average Shareholders' Equity. Tables reconciling the non-GAAP measures Free Cash Flow and return on invested capital (ROIC) to GAAP measures are also on page 10. See Use of Non-GAAP Financial Information below for definition of Free Cash Flow and ROIC.
The following table summarizes net cash from operating activities:
|
(Unaudited, In Thousands) |
Three Months Ended |
||
|
2022 |
2021 |
||
|
Net income |
$ 106,549 |
$ 102,114 |
|
|
Depreciation |
12,416 |
13,157 |
|
|
Amortization |
33,194 |
31,016 |
|
|
Change in deferred income taxes |
(12,345) |
6,088 |
|
|
Other non-cash expenses |
874 |
6,237 |
|
|
Change in receivables |
101,509 |
53,404 |
|
|
Change in deferred revenue |
(65,130) |
(60,662) |
|
|
Change in other assets and liabilities |
(40,236) |
(44,805) |
|
|
NET CASH PROVIDED BY OPERATING ACTIVITIES |
$ 136,831 |
$ 106,549 |
|
The following table summarizes net cash from investing activities:
|
(Unaudited, In Thousands) |
Three Months Ended |
||
|
2022 |
2021 |
||
|
Payment for acquisitions, net of cash acquired* |
$ (228,986) |
$ — |
|
|
Capital expenditures |
(7,737) |
(9,273) |
|
|
Proceeds from dispositions |
26,252 |
14 |
|
|
Purchased software |
(408) |
(1,221) |
|
|
Computer software developed |
(38,715) |
(35,971) |
|
|
NET CASH FROM INVESTING ACTIVITIES |
$ (249,594) |
$ (46,451) |
|
*During first quarter fiscal 2023, the Company completed its previously announced acquisition of Payrailz.
The following table summarizes net cash from financing activities:
|
(Unaudited, In Thousands) |
Three Months Ended |
||
|
2022 |
2021 |
||
|
Borrowings on credit facilities* |
$ 280,000 |
$ — |
|
|
Repayments on credit facilities and financing leases |
(150,022) |
(35,027) |
|
|
Dividends paid |
(35,709) |
(34,036) |
|
|
Net cash from issuance of stock and tax related to stock-based |
1,677 |
2,224 |
|
|
NET CASH FROM FINANCING ACTIVITIES |
$ 95,946 |
$ (66,839) |
|
*The Company's acquisition of Payrailz during first quarter fiscal 2023 was primarily funded by new borrowings on credit facilities.
Use of Non-GAAP Financial Information
Generally Accepted Accounting Principles (GAAP) is the term used to refer to the standard framework of guidelines for financial accounting in
We believe non-GAAP financial measures help investors better understand the underlying fundamentals and true operations of our business. The non-GAAP financial measures presented, adjusted revenue, adjusted operating income, adjusted operating income margin, adjusted segment income, adjusted cost of revenue, and adjusted operating expenses, eliminate one-time deconversion fees, acquisitions, divestitures, and gain/loss, all of which management believes are not indicative of the Company's operating performance. Such adjustments give investors further insight into our performance. Non-GAAP EBITDA is defined as net income attributable to the Company before the effect of interest expense, taxes, depreciation, and amortization, adjusted for net income before the effect of interest expense, taxes, depreciation, and amortization attributable to eliminated one-time deconversion fees, acquisitions and divestitures, and gain/loss. Free cash flow is defined as net cash from operating activities, less capitalized expenditures, internal use software, and capitalized software, plus proceeds from the sale of assets. ROIC is defined as net income divided by average invested capital, which is the average of beginning and ending long-term debt and stockholders' equity for a given period. Management believes that non-GAAP EBITDA is an important measure of the Company's overall operating performance and excludes certain costs and other transactions that management deems one time or non-operational in nature; free cash flow is useful to measure the funds generated in a given period that are available for debt service requirements and strategic capital decisions; and ROIC is a measure of the Company's allocation efficiency and effectiveness of its invested capital. For these reasons, management also uses these non-GAAP financial measures in its assessment and management of the Company's performance.
Non-GAAP financial measures used by the Company may not be comparable to similarly titled non-GAAP measures used by other companies. Non-GAAP financial measures have no standardized meaning prescribed by GAAP and therefore, are unlikely to be comparable with calculations of similar measures for other companies.
Any non-GAAP financial measures should be considered in context with the GAAP financial presentation and should not be considered in isolation or as a substitute for GAAP measures. Reconciliations of the non-GAAP financial measures to related GAAP measures are included.
Quarterly Conference Call
The Company will hold a conference call on
About
Jack Henry (Nasdaq: JKHY) is a well-rounded financial technology company that strengthens connections between financial institutions and the people and businesses they serve. We are an S&P 500 company that prioritizes openness, collaboration, and user centricity — offering banks and credit unions a vibrant ecosystem of internally developed modern capabilities as well as the ability to integrate with leading fintechs. For more than 45 years, Jack Henry has provided technology solutions to enable clients to innovate faster, strategically differentiate, and successfully compete while serving the evolving needs of their accountholders. We empower approximately 8,000 clients with people-inspired innovation, personal service, and insight-driven solutions that help reduce the barriers to financial health. Additional information is available at www.jackhenry.com.
Statements made in this news release that are not historical facts are "forward-looking statements" within the meaning of the Private Securities Litigation Reform Act of 1995, Section 27A of the Securities Act of 1933 and Section 21E of the Securities Exchange Act of 1934. Because forward-looking statements relate to the future, they are subject to inherent risks and uncertainties that could cause actual results to differ materially from those expressed or implied by such statements. Such risks and uncertainties include, but are not limited to, those discussed in the Company's
|
Condensed Consolidated Statements of Income (Unaudited) |
|||||
|
(In Thousands, except per share data) |
Three Months Ended |
% Change |
|||
|
2022 |
2021 |
||||
|
REVENUE |
$ 529,202 |
$ 488,056 |
8 % |
||
|
Cost of Revenue |
298,261 |
276,636 |
8 % |
||
|
Research and Development |
32,993 |
26,754 |
23 % |
||
|
Selling, General, and Administrative |
57,225 |
51,071 |
12 % |
||
|
EXPENSES |
388,479 |
354,461 |
10 % |
||
|
OPERATING INCOME |
140,723 |
133,595 |
5 % |
||
|
Interest income |
152 |
7 |
2,071 % |
||
|
Interest expense |
(1,576) |
(248) |
535 % |
||
|
Interest Income (Expense) |
(1,424) |
(241) |
491 % |
||
|
INCOME BEFORE INCOME TAXES |
139,299 |
133,354 |
4 % |
||
|
Provision for Income Taxes |
32,750 |
31,240 |
5 % |
||
|
NET INCOME |
$ 106,549 |
$ 102,114 |
4 % |
||
|
Diluted net income per share |
$ 1.46 |
$ 1.38 |
|||
|
Diluted weighted average shares outstanding |
73,138 |
74,142 |
|||
|
Consolidated Balance Sheet Highlights (Unaudited) |
|||||
|
(In Thousands) |
|
% Change |
|||
|
2022 |
2021 |
||||
|
Cash and cash equivalents |
$ 31,970 |
$ 44,251 |
(28) % |
||
|
Receivables |
247,541 |
253,160 |
(2) % |
||
|
Total assets |
2,578,460 |
2,280,911 |
13 % |
||
|
Accounts payable and accrued expenses |
$ 195,518 |
$ 161,088 |
21 % |
||
|
Current and long-term debt |
245,041 |
65,166 |
276 % |
||
|
Deferred revenue |
345,146 |
334,939 |
3 % |
||
|
Stockholders' equity |
1,461,138 |
1,395,665 |
5 % |
||
|
Calculation of Non-GAAP Earnings Before Income Taxes, Depreciation and Amortization (Non-GAAP EBITDA) |
|||||
|
Three Months Ended |
% Change |
||||
|
(in thousands) |
2022 |
2021 |
|||
|
Net income |
$ 106,549 |
$ 102,114 |
|||
|
Interest expense |
1,576 |
248 |
|||
|
Taxes |
32,750 |
31,240 |
|||
|
Depreciation and amortization |
45,610 |
44,173 |
|||
|
Less: Net income before interest expense, taxes, depreciation and |
(8,847) |
(3,184) |
|||
|
NON-GAAP EBITDA |
$ 177,638 |
$ 174,591 |
2 % |
||
|
*The first quarter adjustments for net income before interest expense, taxes, |
|||||
|
Calculation of Free Cash Flow (Non-GAAP) |
|||||
|
Three Months Ended |
|||||
|
(in thousands) |
2022 |
2021 |
|||
|
Net cash from operating activities |
$ 136,832 |
$ 106,549 |
|||
|
Capitalized expenditures |
(7,737) |
(9,273) |
|||
|
Internal use software |
(408) |
(1,221) |
|||
|
Proceeds from sale of assets |
26,252 |
14 |
|||
|
Capitalized software |
(38,715) |
(35,971) |
|||
|
FREE CASH FLOW |
$ 116,224 |
$ 60,098 |
|||
|
Calculation of the Return on Average Shareholders' Equity |
|||||
|
|
|||||
|
( in thousands) |
2022 |
2021 |
|||
|
Net income (trailing four quarters) |
$ 367,352 |
$ 322,366 |
|||
|
Average stockholder's equity (period ending balances) |
1,428,401 |
1,469,708 |
|||
|
RETURN ON AVERAGE SHAREHOLDERS' EQUITY |
25.7 % |
21.9 % |
|||
|
Calculation of Return on |
|||||
|
|
|||||
|
(in thousands) |
2022 |
2021 |
|||
|
Net income (trailing four quarters) |
$ 367,352 |
$ 322,366 |
|||
|
Average stockholder's equity (period ending balances) |
1,428,401 |
1,469,708 |
|||
|
Average current maturities of long-term debt (period ending balances) |
76 |
118 |
|||
|
Average long-term debt (period ending balances) |
155,028 |
32,613 |
|||
|
Average invested capital |
$ 1,583,505 |
$ 1,502,439 |
|||
|
ROIC |
23.2 % |
21.5 % |
|||
![]() View original content to download multimedia:https://www.prnewswire.com/news-releases/jack-henry--associates-inc-reports-first-quarter-fiscal-2023-results-301672209.html
View original content to download multimedia:https://www.prnewswire.com/news-releases/jack-henry--associates-inc-reports-first-quarter-fiscal-2023-results-301672209.html
SOURCE
MEDIA CONTACT: Mark Folk, Corporate Communications, Jack Henry & Associates, Inc., 704-890-5323, MFolk@jackhenry.com; ANALYST CONTACT: Vance Sherard, CFA, Investor Relations, Jack Henry & Associates, Inc., 417-235-6652, VSherard@jackhenry.com